FAIR TRADE IMPACT REPORT
A modular long-scroll reporting system that turns dense impact data into a clear, reusable webpage.
This project translates a static impact report into a web-first, long-scroll reporting system built entirely in Figma as a modular component library. Rather than designing a single page, I focused on creating a reusable system that could support future impact reports with minimal redesign.
Output: responsive webpage layout + component library + chart/table formatting system.
The Challenge
Impact reports often suffer from three structural problems:
-
They are PDF-first, not designed for scrolling or screen reading
-
Each report is treated as a one-off, requiring full redesign every year
-
Data is difficult to maintain consistently across charts, tables, and narratives
The challenge was to design something that was:
-
flexible enough for different datasets and brands
-
consistent enough to feel credible and official
-
easy to update year-over-year

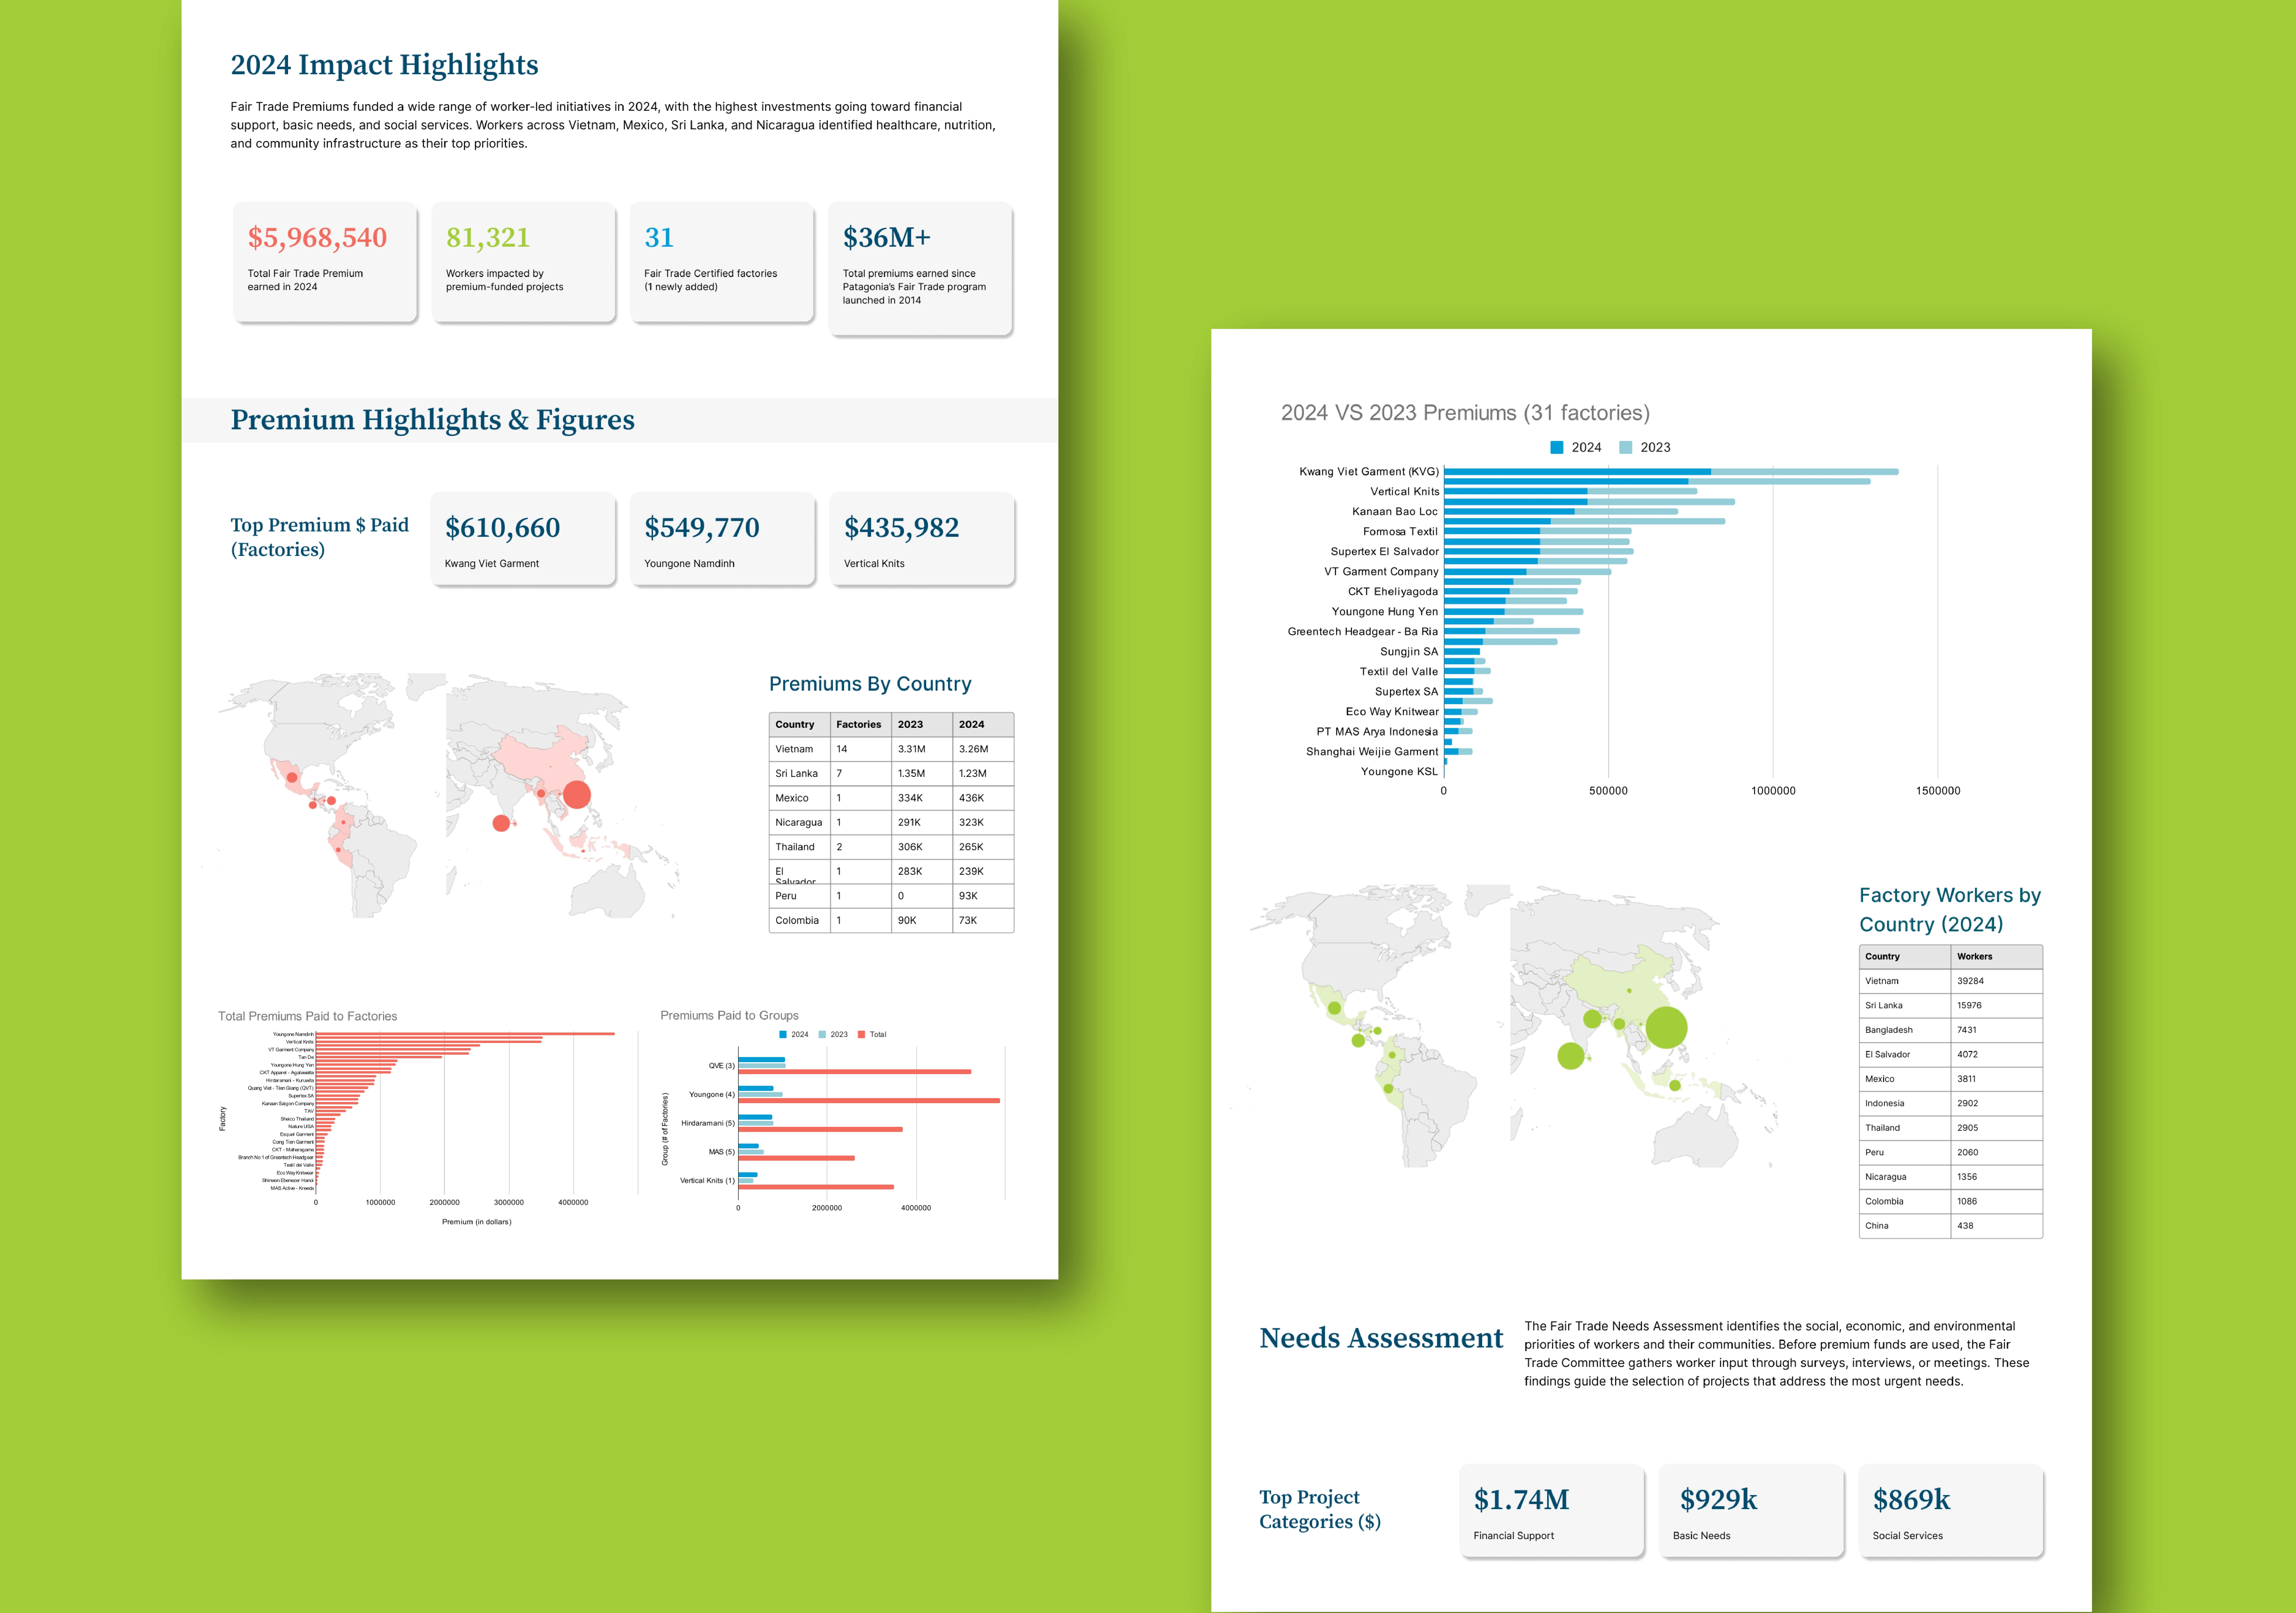
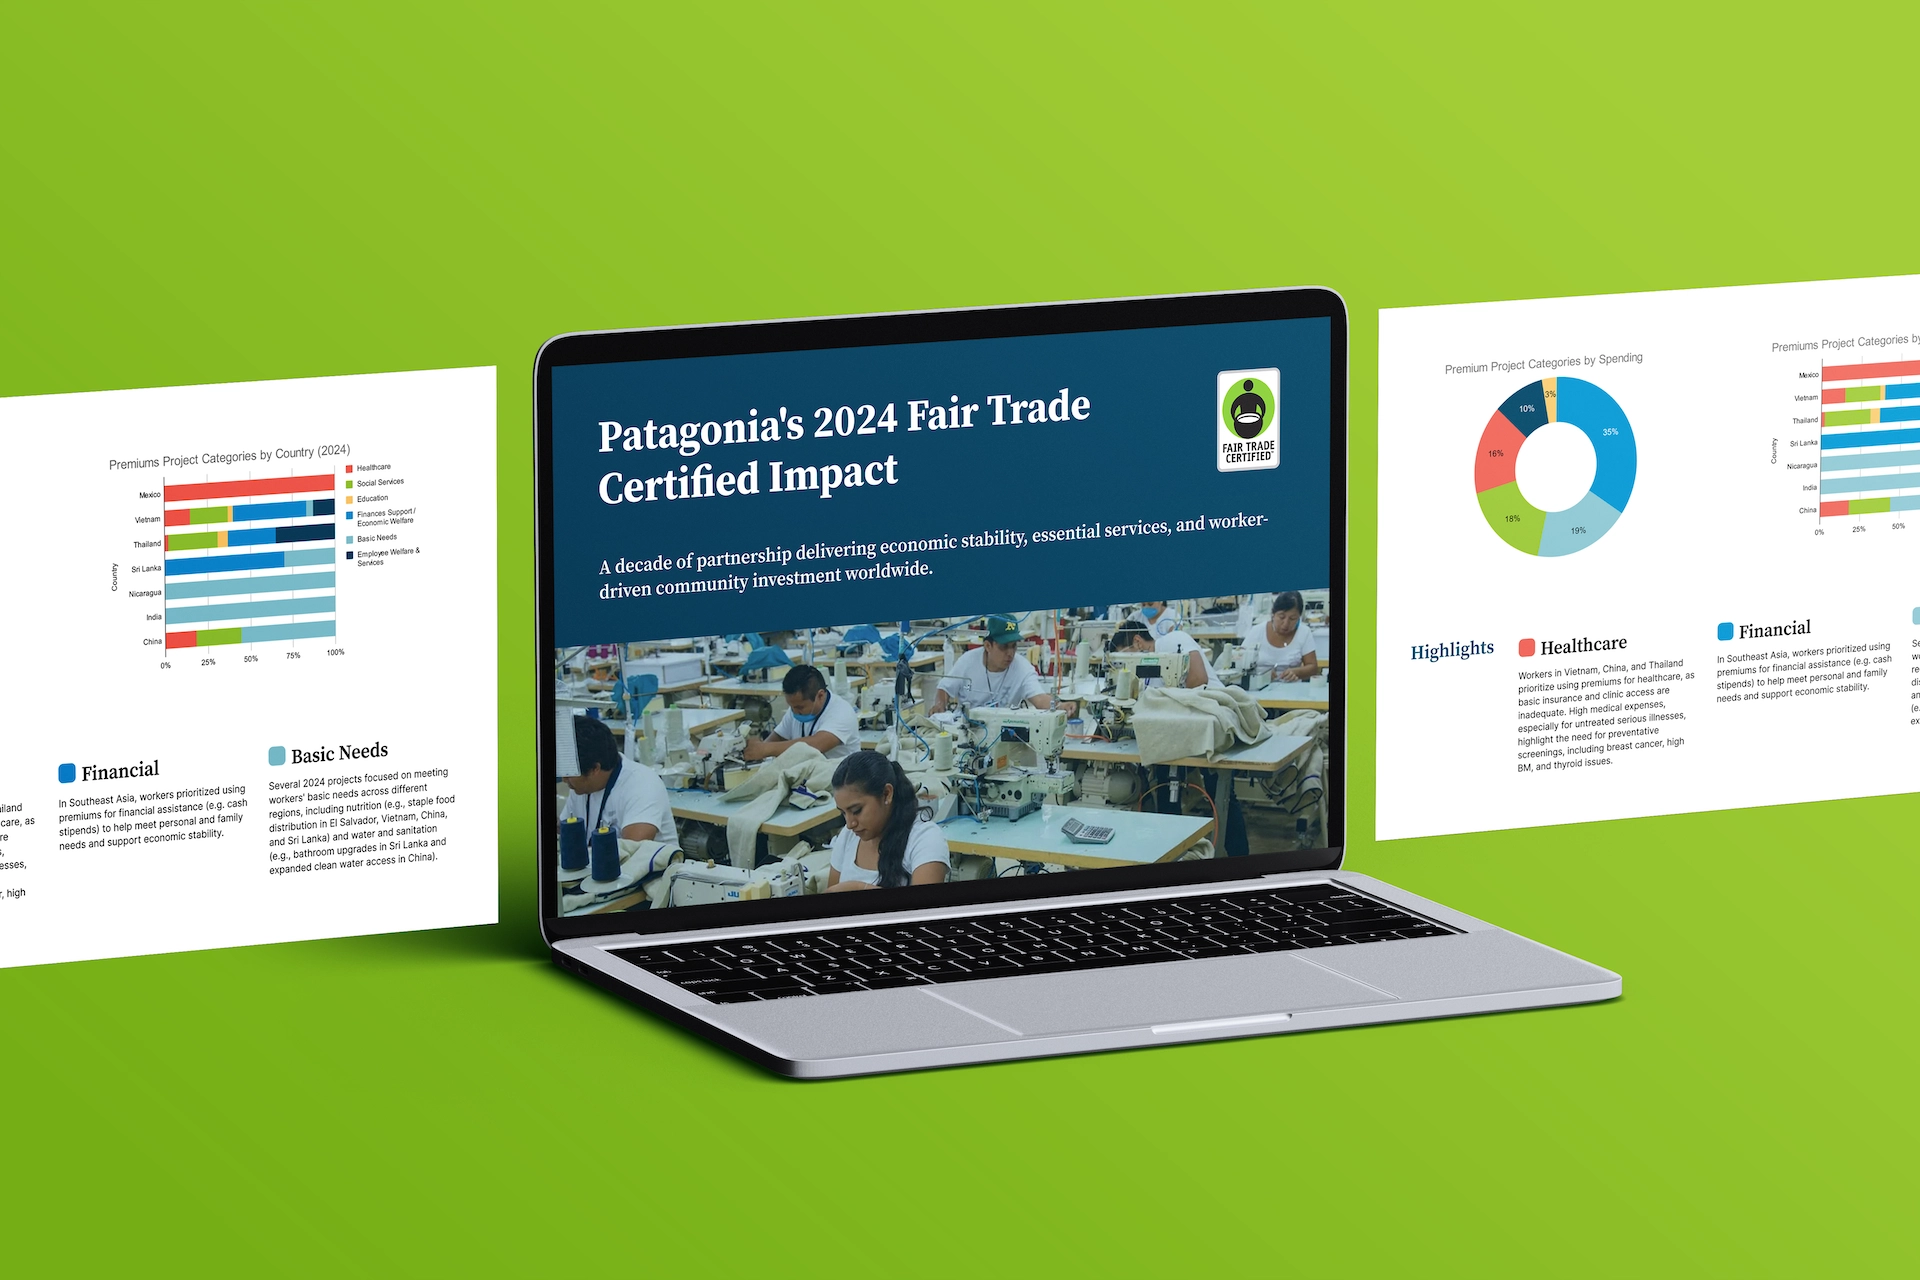
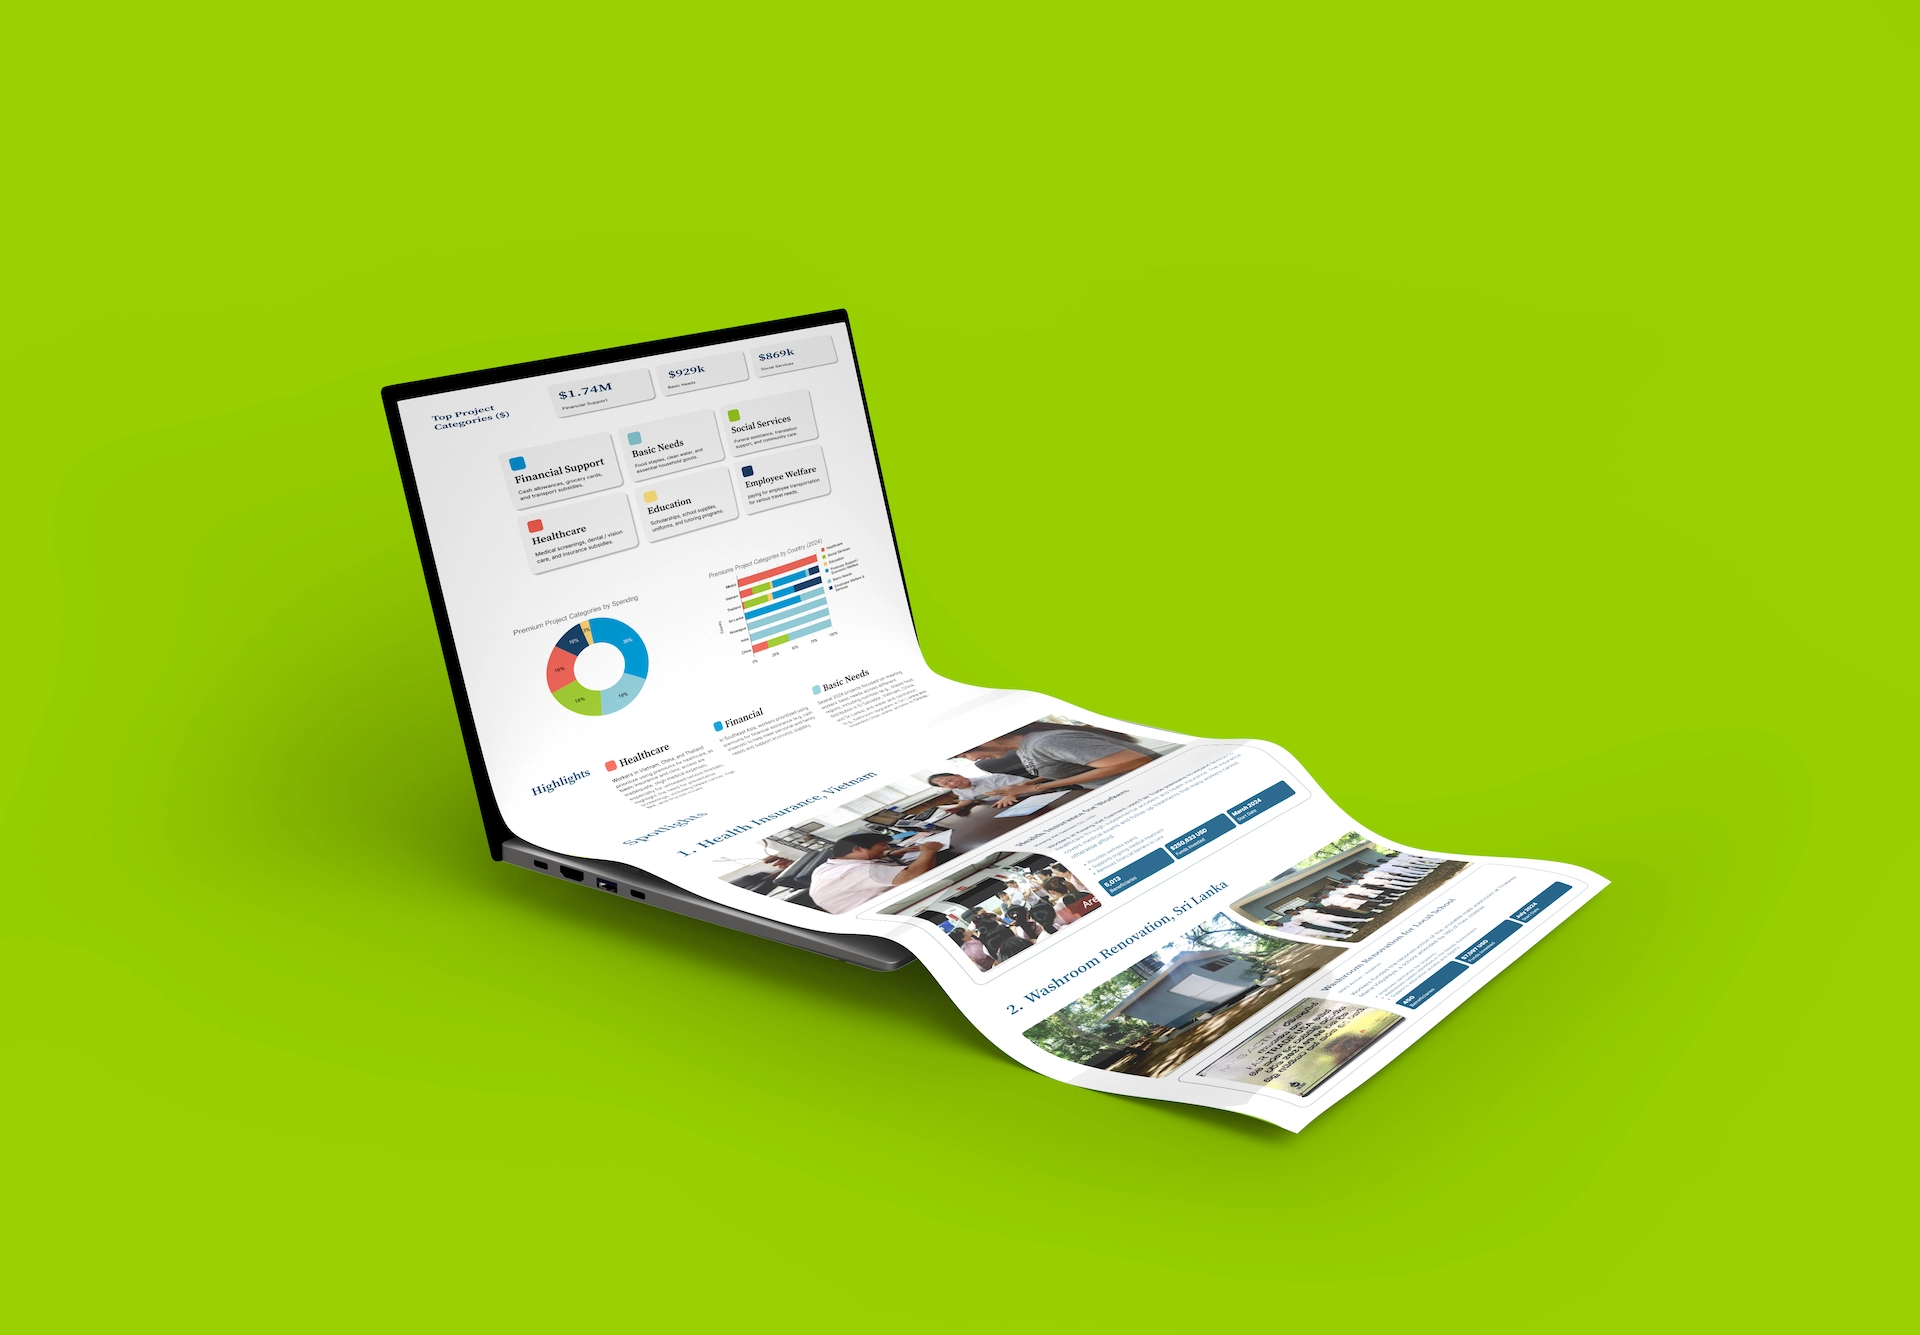
Original Impact Report

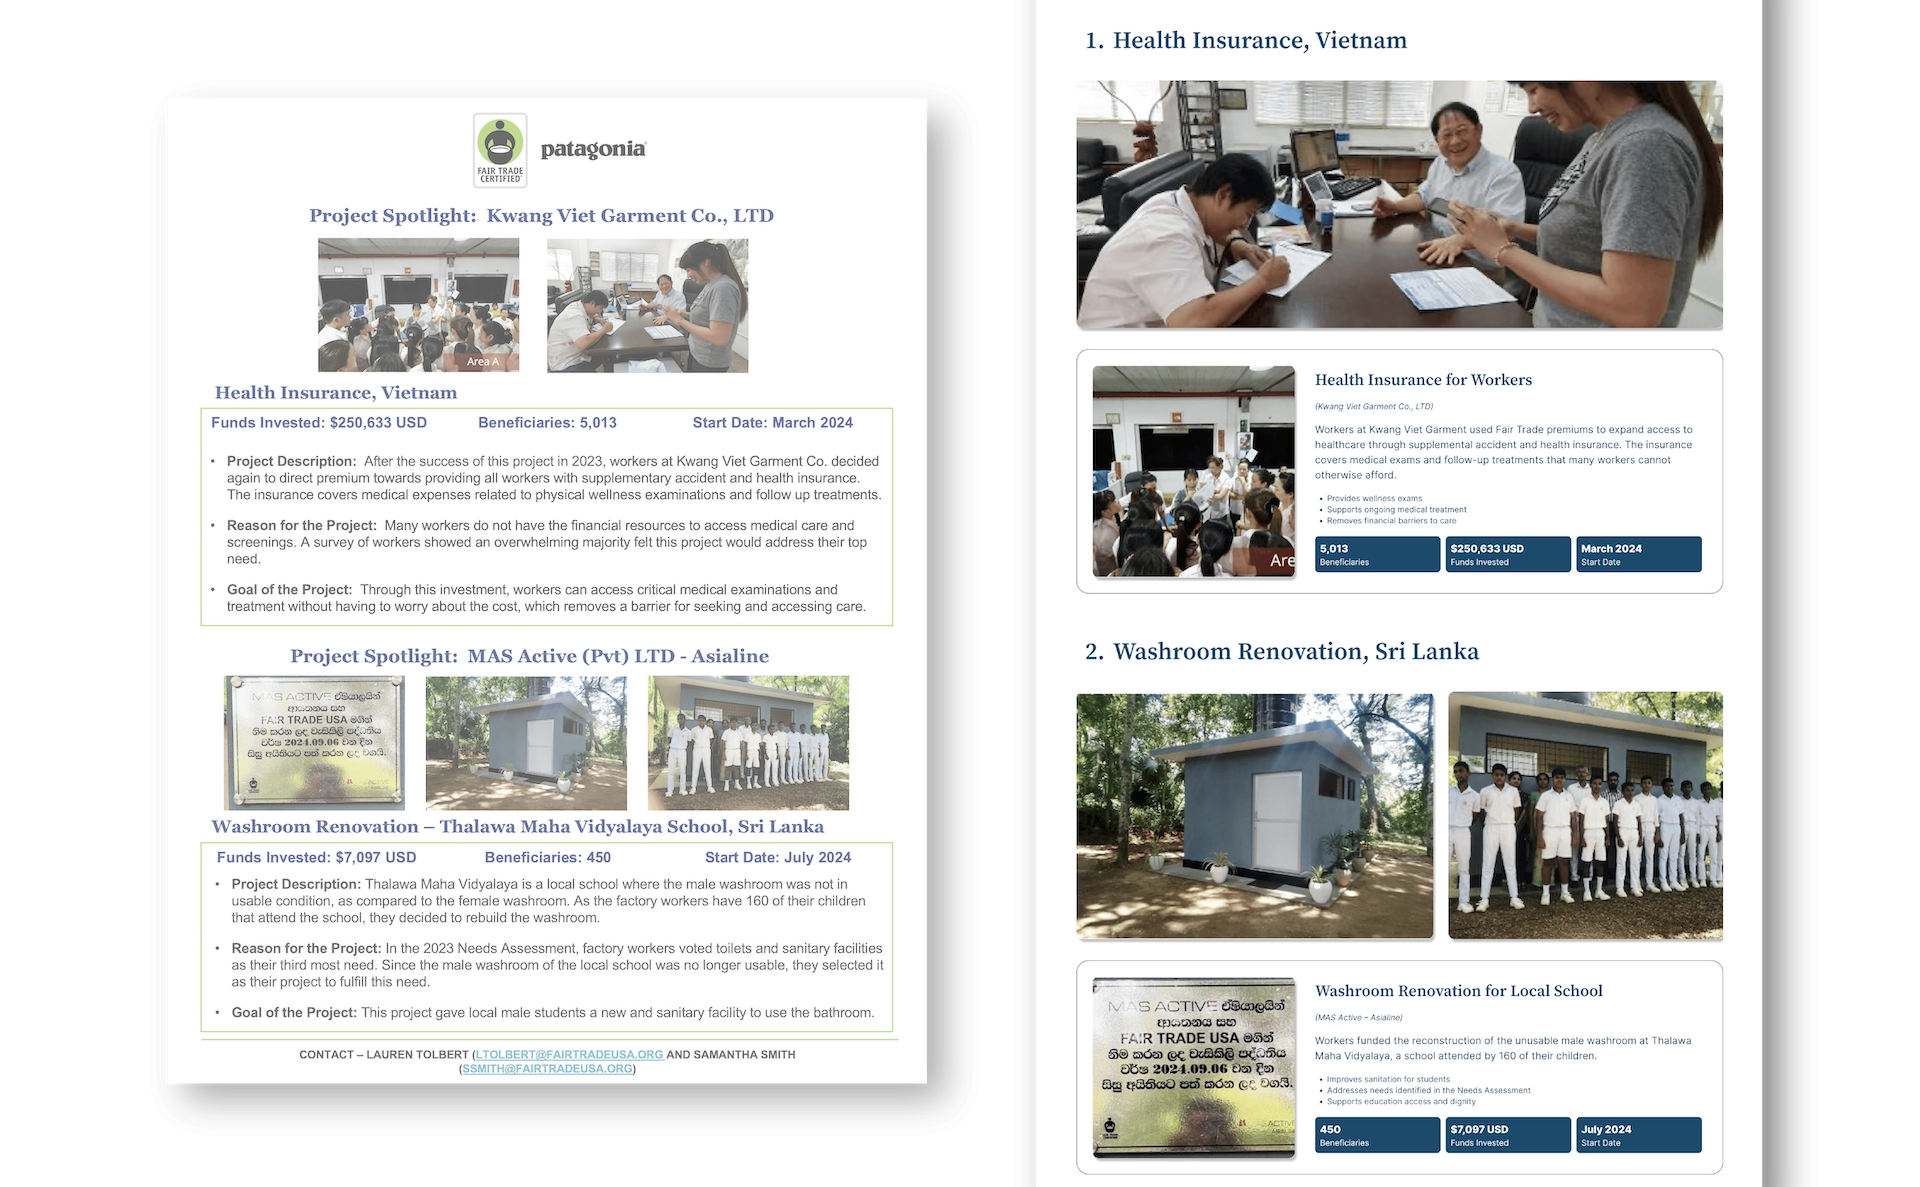
Original (left) vs. Redesign (right)
System-First Approach in Figma
Instead of starting with a finished layout, I began by building the system inside Figma.
1. Page Structure in Figma
I separated the file into clear working layers:
-
Design System – type, color, spacing rules
-
Components – reusable blocks and data structures
-
Webpage Layout – assembled using only components
This allowed me to iterate on structure without disrupting final layouts.
Core Components
-
Section headers (kicker + title + intro)
-
Metric cards (single + 3-up variants)
-
Chart containers (single, stacked)
-
Data tables (header + row components)
-
Spotlight story cards (image + text + metrics)
Each component includes:
-
consistent internal padding
-
text styles tied to the design system
-
scalable widths for responsive thinking
Variants were used for:
-
different column counts
-
highlighted vs standard states
-
year-over-year comparisons (2023 / 2024)
The final webpage layout was assembled entirely from components—no custom one-off sections.
This ensured:
-
visual consistency across the page
-
fast iteration when content order changed
-
a true “template” rather than a static mockup
Why This System Works
-
Scalable: new sections can be added without redesign
-
Maintainable: data changes don’t break layout
-
Reusable: supports future reports and other brands
-
Web-native: designed for scrolling, scanning, and hierarchy
What This Demonstrates (for reviewers)
-
Systems thinking, not just visual styling
-
Strong command of Figma components & Auto Layout
-
Ability to design for data-heavy, real-world content
-
Understanding of scalability and maintenance